Learning to Work (LTW)
Published · LiveA multi-deliverable design project for NYC Public Schools' LTW program — a live research hub, a shared visual reporting system, and two published research reports distributed to CBOs, transfer schools, and the NYC DOE.
Rich data. No shared language to read it.
New York State's Work-Based Learning program generates significant qualitative and quantitative data on student outcomes internship performance, skill development, workplace readiness, and program completion. Schools across the state were collecting this data. The problem was what happened next.
Reporting formats varied by school. Visualizations, when they existed at all, were inconsistent. An administrator at one school couldn't meaningfully compare outcomes with another. A program coordinator reviewing multiple schools' reports had to mentally translate between different data presentations before they could interpret anything.
The data existed. The infrastructure to make it legible, across schools, across districts, at the state level didn't. This project was about building that infrastructure.
My role
UI/UX Designer & Front-End Developer responsible for the information design system, visual language, and full platform build on Google Sites.
Timeline
2022 – 2023 · Platform live and actively maintained
Primary users
- NYS program coordinators
- School administrators
- Teachers and counselors reviewing student progress
- District-level reviewers comparing across schools
Fragmented data. No system for making sense of it.
When every school reports differently, comparison becomes impossible. When visualizations are inconsistent, pattern recognition fails. When the hub is a collection of scattered links and documents, retrieval is friction-heavy.
The consequence isn't just inconvenience it's that student outcomes become invisible to the people responsible for acting on them. You can't improve what you can't read.
- Fragmented reporting formats — No consistent template across schools. Each report required interpretation from scratch.
- Inconsistent visual language — Charts, icons, and data representations varied, making cross-school comparison impossible without manual translation.
- No centralized portal — Resources were spread across links, emails, and documents with no single access point.
- High cognitive load for reviewers — Administrators reviewing multiple schools had to context-switch constantly between different data presentations.
Building a shared visual system, not just a website
The goal wasn't a prettier report. It was a consistent enough visual language that anyone reviewing any school's data could interpret it immediatel, without a legend, without a guide, without translation.
- Built a centralized portal to eliminate link-sprawl. All resources, reports, and tools live in one place with consistent navigation. Retrieval friction dropped from multi-step searches to a single access point.
- Designed modular report templates to standardize interpretation. Every school's data now uses the same structure, the same visual hierarchy, and the same chart types. Cross-school comparison became possible without translation.
- Used iconography and infographics to reduce cognitive load. Heavy data tables were replaced with visual summaries that communicate outcomes at a glance, without sacrificing the underlying detail.
- Constrained the visual system deliberately. Fewer chart types. Consistent color meaning. Repeated patterns. Constraint here is a featur, every deviation from the system breaks the ability to compare.
- Built on Google Sites for maintainability. The platform needed to be updatable by non-technical staff after handoff. Technology choice was a UX decision, not just an infrastructure one.
The visual system designed for cross-school legibility
Design principles applied
- Consistency over creativity — the system serves comparison, not expression
- Visual hierarchy aligned with decision-making priority
- Iconography that reduces reading load without losing precision
- Modular templates that scale across any school without custom work
Two published reports — designed for the people doing the work
I designed both reports for Eskolta's LTW Model Research — taking a year of field research and turning it into documents practitioners would actually read. Audience: CBO staff, school principals, NYC DOE program leadership.
Learning to Work at its Best — Transfer Schools
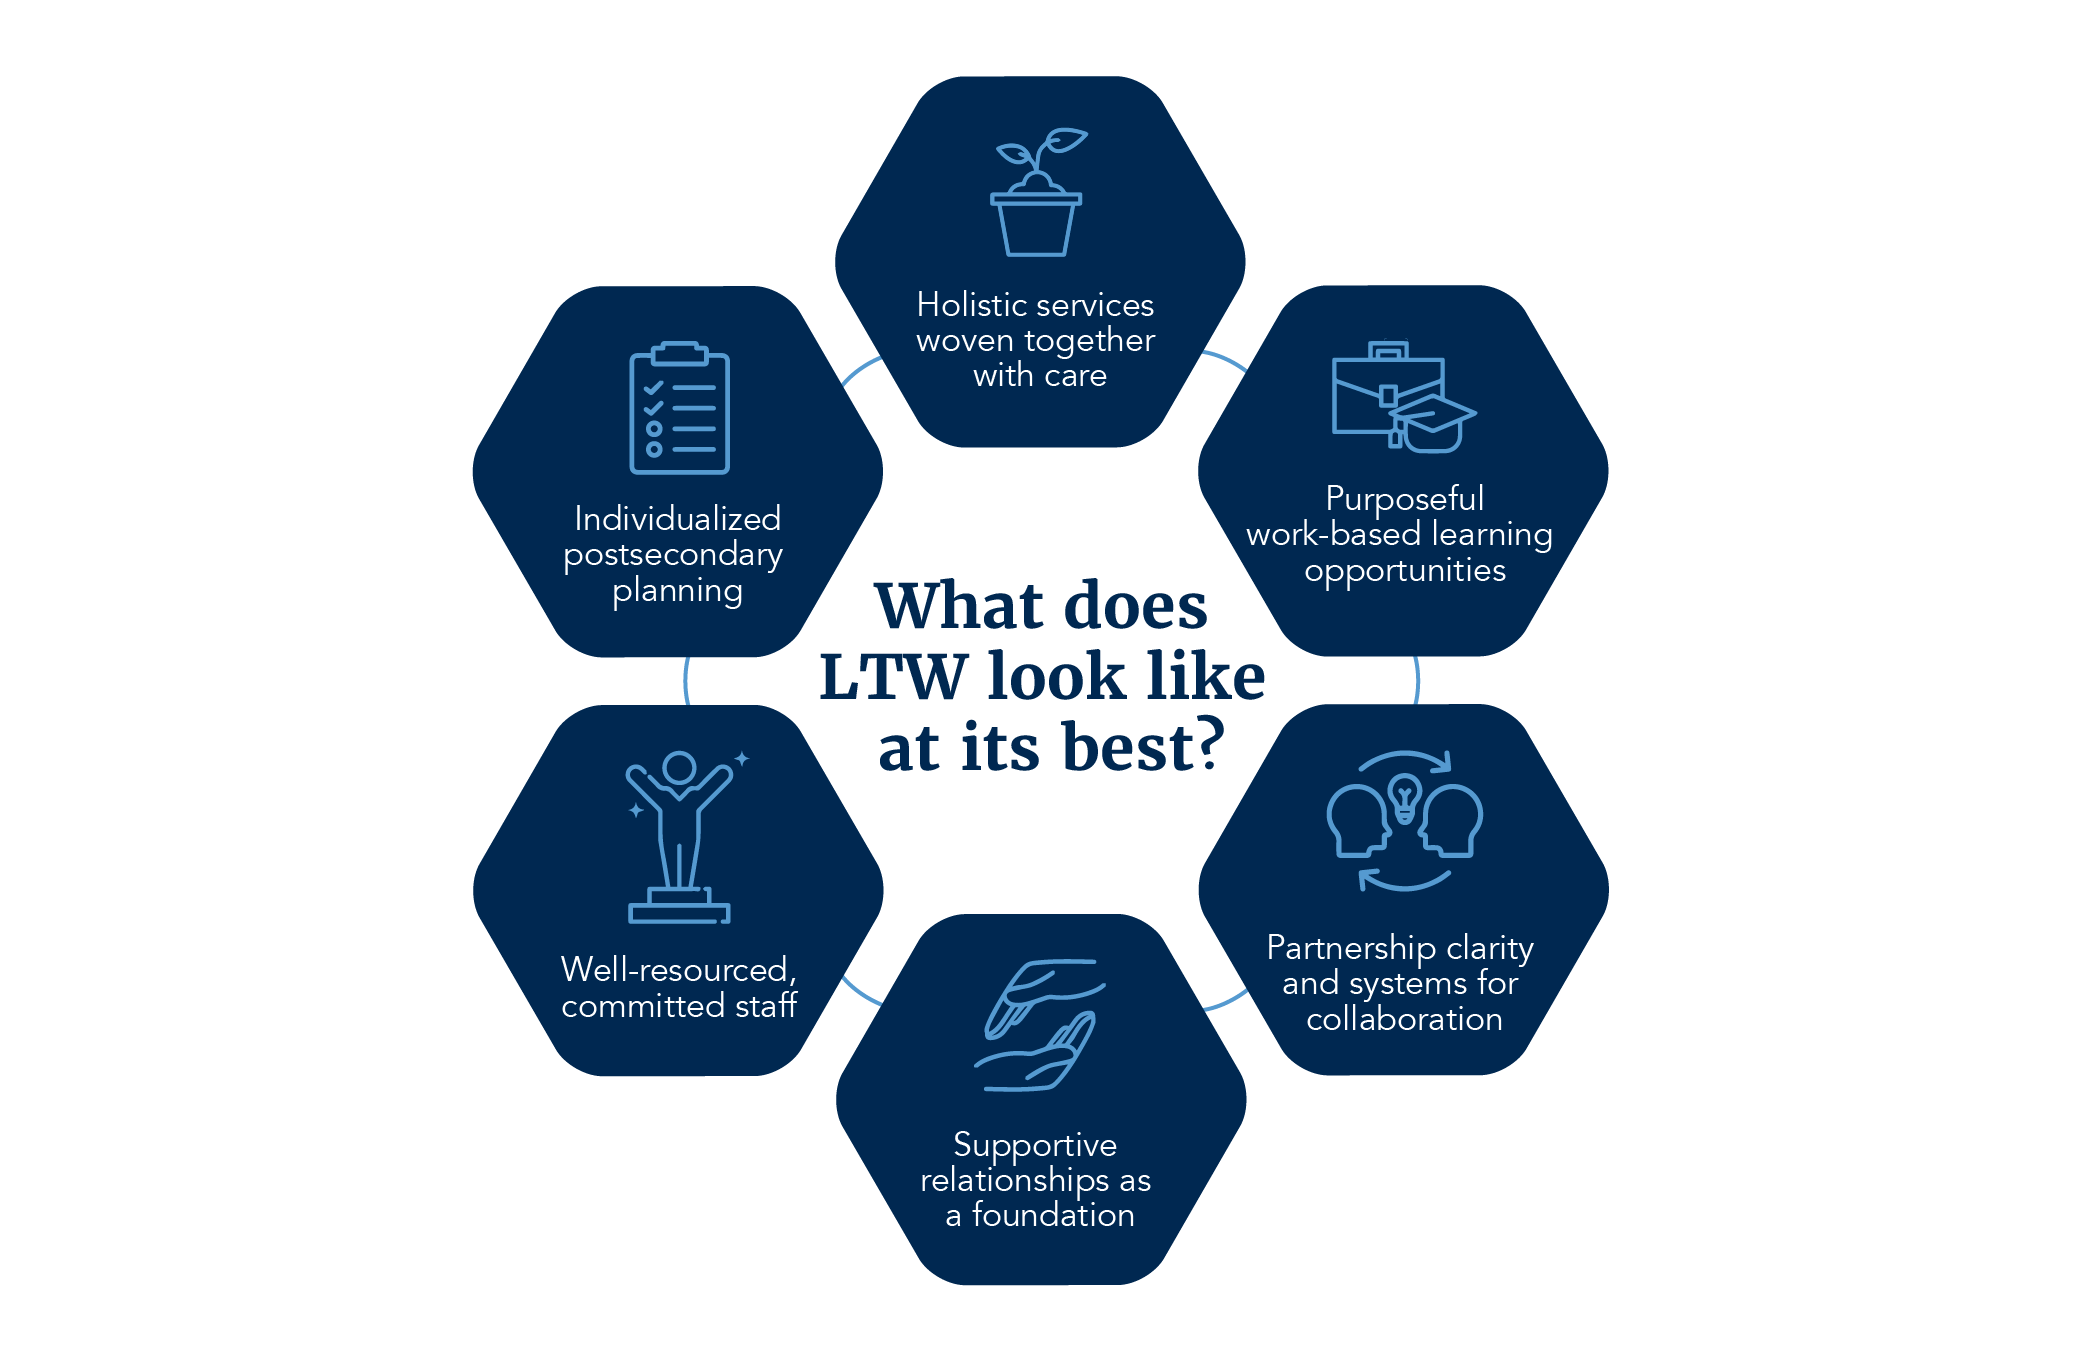
Research findings from 25 NYC transfer high schools — covering six core program elements, practitioner testimony, quantitative outcomes, and five concrete recommendations for CBO and DOE central teams.
View Report — Transfer SchoolsLearning to Work at its Best — Young Adult Borough Centers
Research findings from 12 YABCs citywide — addressing the program's evolving model, the shift toward younger "shared instruction" students, and challenges for CBO staff navigating changing roles and responsibilities.
View Report — YABCsPublished. Live. Read by the people who need it.
Three distinct deliverables. One project. All of it live, distributed, and in active use by CBO staff, school administrators, and NYC DOE program leadership.
Two reports published and distributed citywide — research designed for the people doing the work across 25 transfer schools and 12 YABCs, covering six core program elements and five actionable recommendations.
Research findings made navigable, not just downloadable — the live Google Sites hub structures a year of qualitative research into a format CBO staff and school principals can actually scan and use.
Cross-school comparison enabled — the shared visual reporting system lets administrators review outcomes across schools using the same language, without manually translating between formats.
Retrieval friction eliminated — one centralized portal replaced scattered links, emails, and documents with a single access point for all program resources.
Non-technical maintainability — both the research site and reporting hub were built for handoff. CBO staff and DOE program coordinators update content without designer involvement.