New Classrooms Innovation Partners
Teacher Portal · Student Portal · Internal Tools
Eight years as the sole UI/UX Designer and Front-End Designer across three connected product surfaces — building durable systems for instruction, student learning, and internal operations at national scale.
Eight years. Three surfaces. One designer.
New Classrooms Innovation Partners operates at the intersection of curriculum, student data, and school operations — a personalized learning organization deploying adaptive math instruction at national scale. For eight years, I was the sole designer responsible for every user-facing surface: the tool teachers use daily, the interface students learn through, and the internal systems operations teams depend on.
That constraint wasn't a limitation. It was a forcing function. When one person owns all three surfaces, consistency isn't optional — it's the only way to build something that holds together. Design decisions made on the teacher portal had to work with the student portal. Internal tool patterns had to align with what educators already understood. The system had to be coherent, because the same organization was using all of it.
This is a case study about building durable systems under real constraints — not just shipping features.
My role
Sole UI/UX Designer & Front-End Designer — responsible for all three product surfaces across the full 8-year tenure.
Scale
National deployment across schools — teachers and students using these platforms as part of their daily instructional workflow.
Design priorities
- Cognitive load reduction
- Workflow integrity across surfaces
- Consistency at scale
- Reusable, maintainable patterns
What I built — and why each surface demanded different thinking
Each surface serves a fundamentally different user with different goals, different time constraints, and different tolerance for complexity. The challenge was designing all three to feel like they belong to the same system.
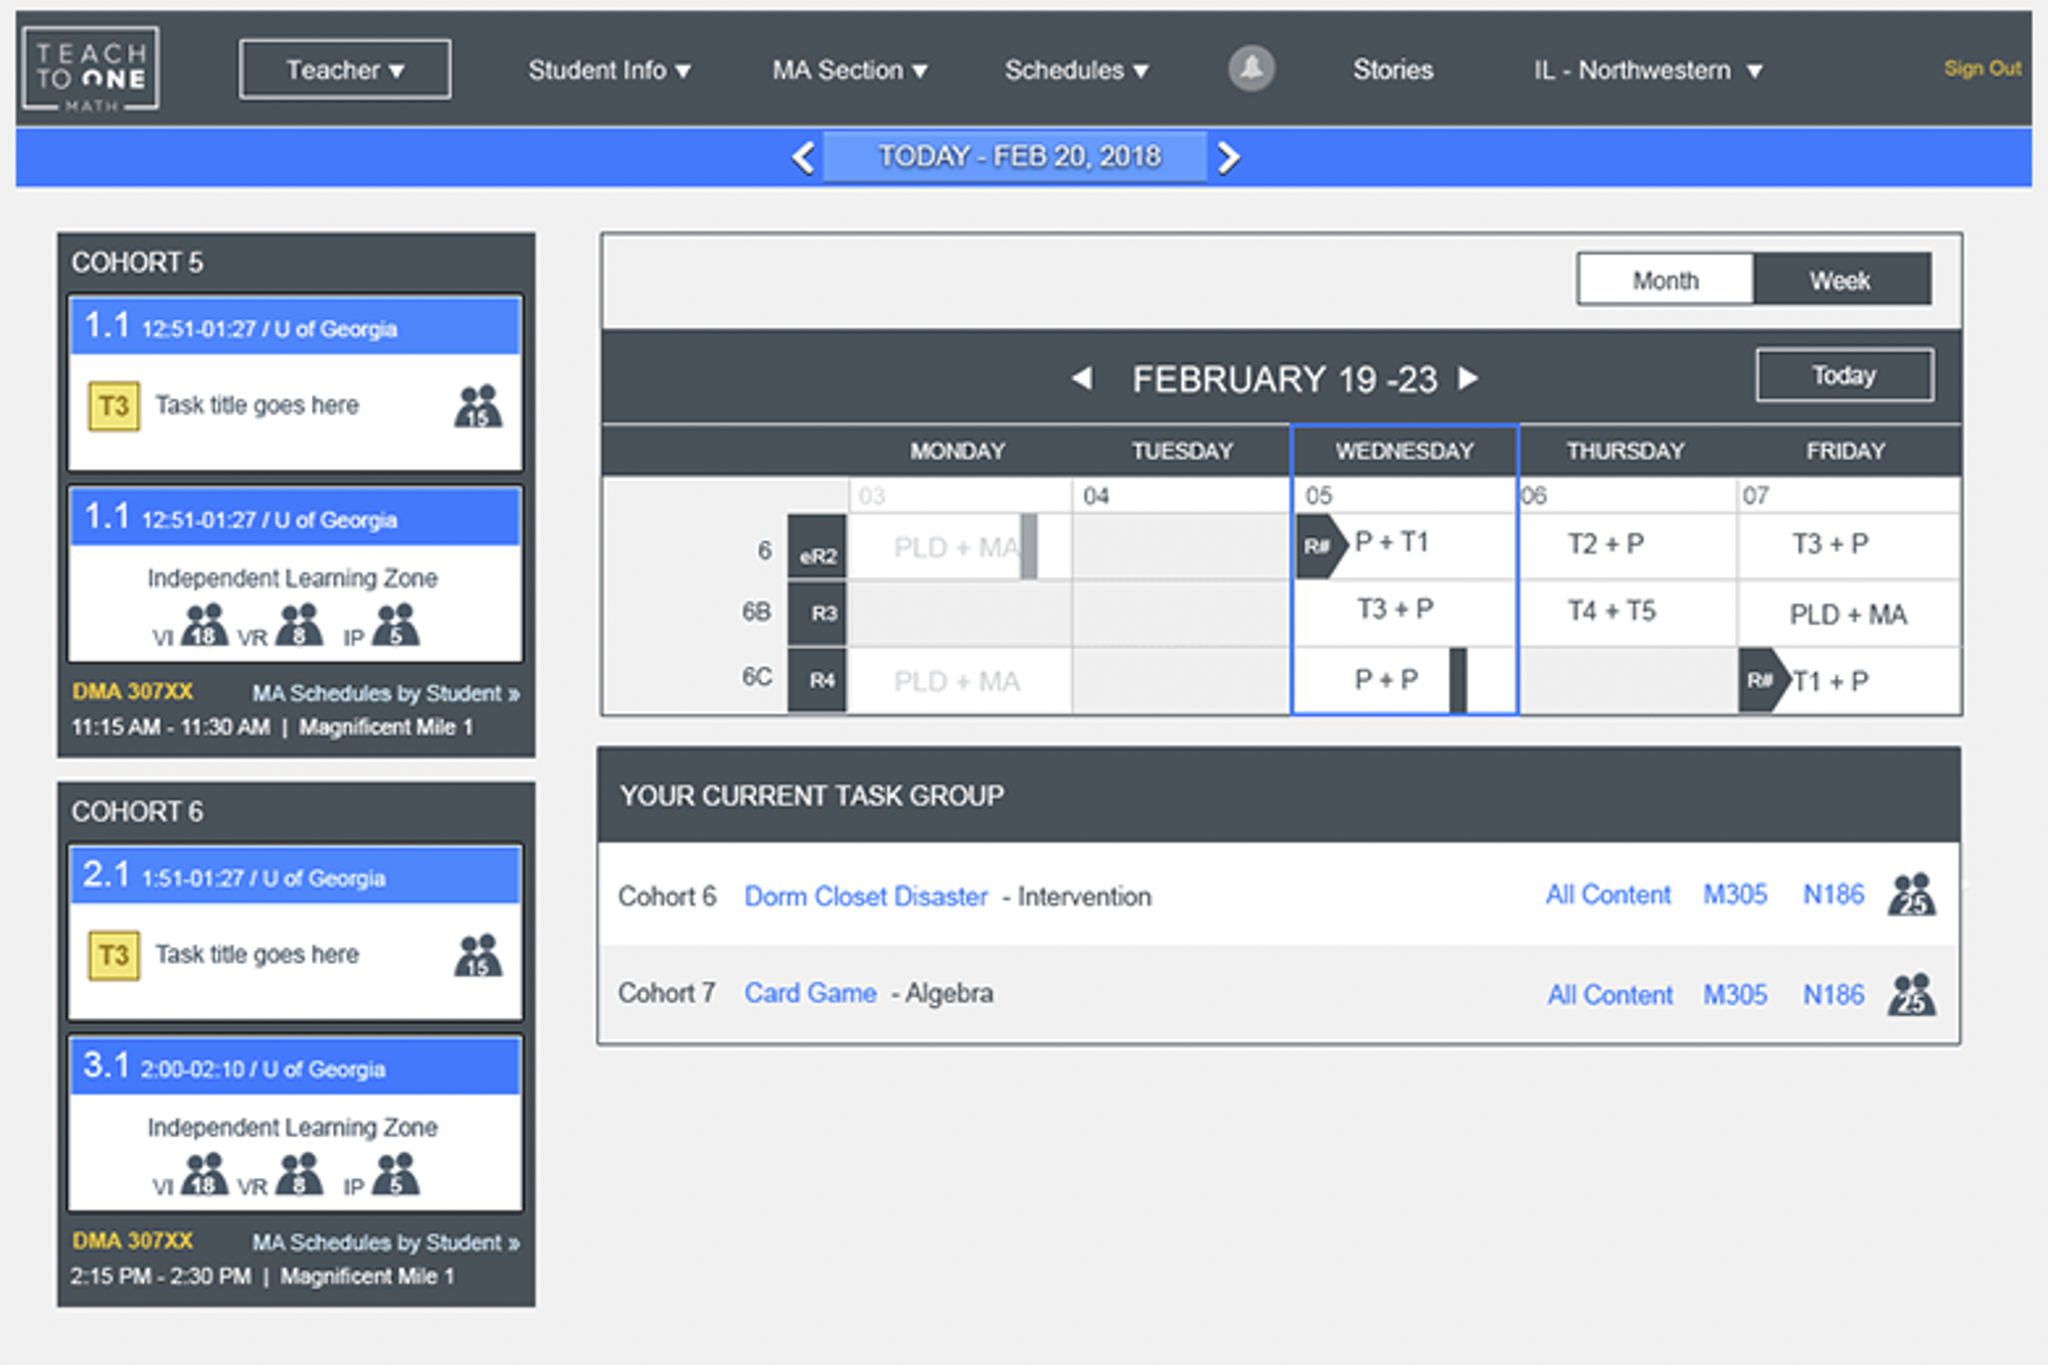
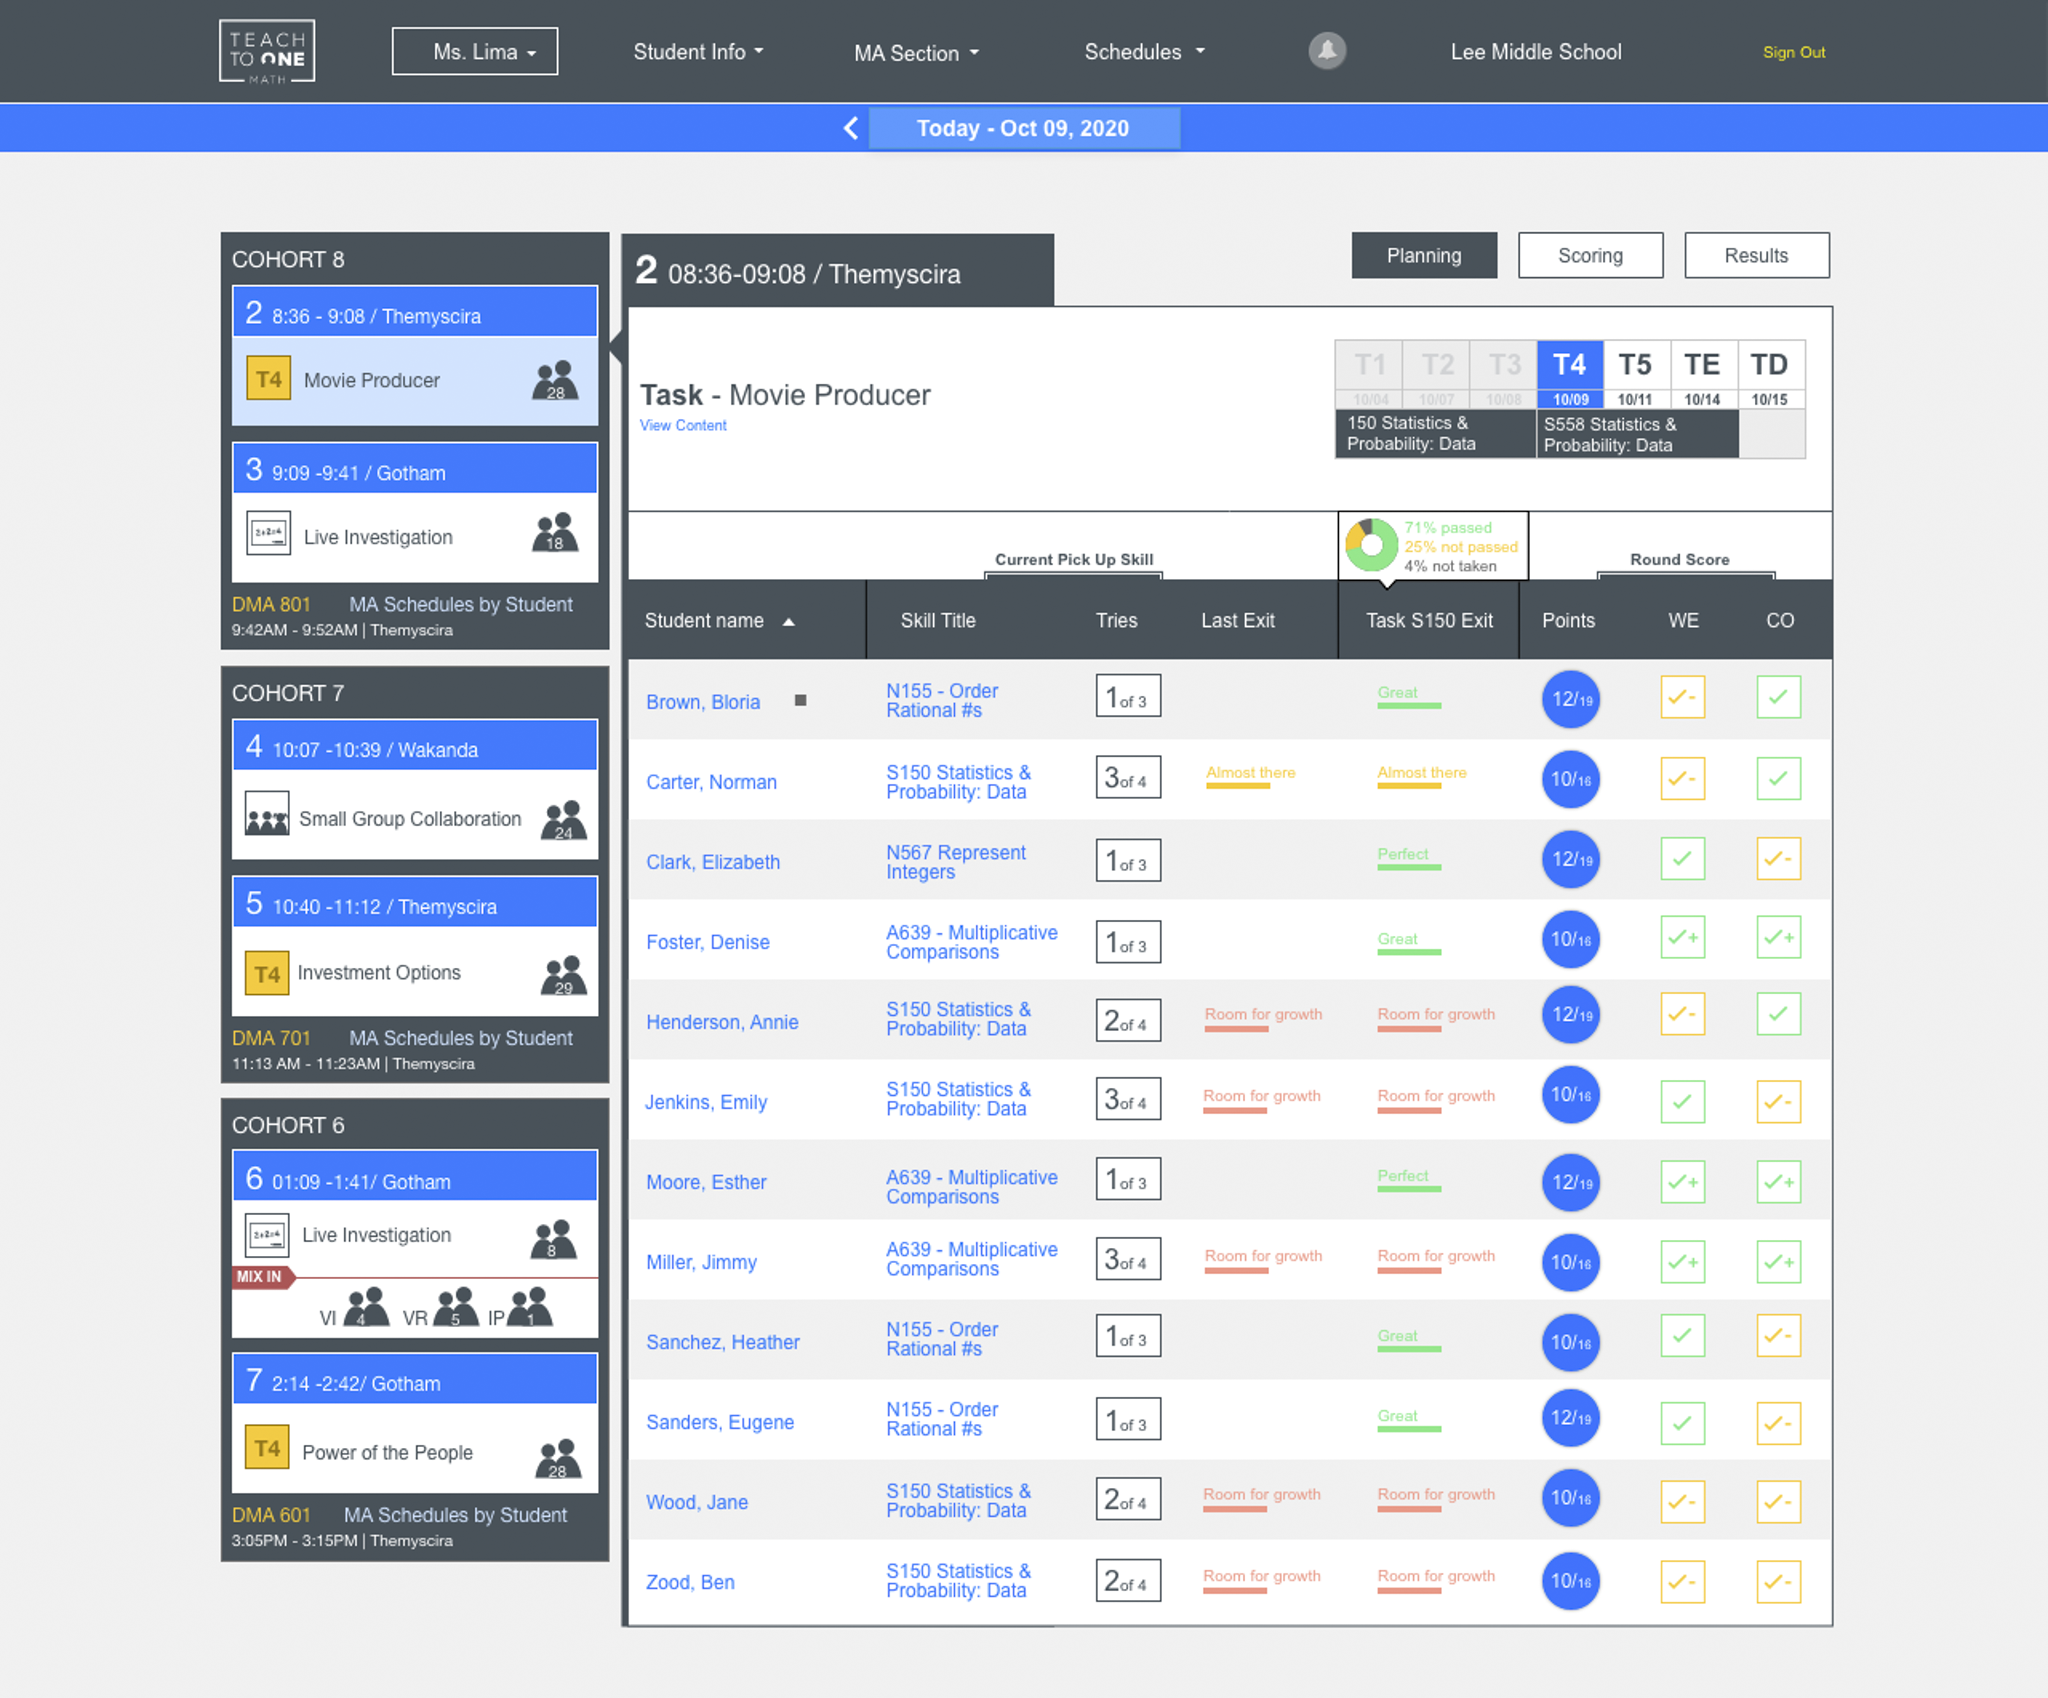
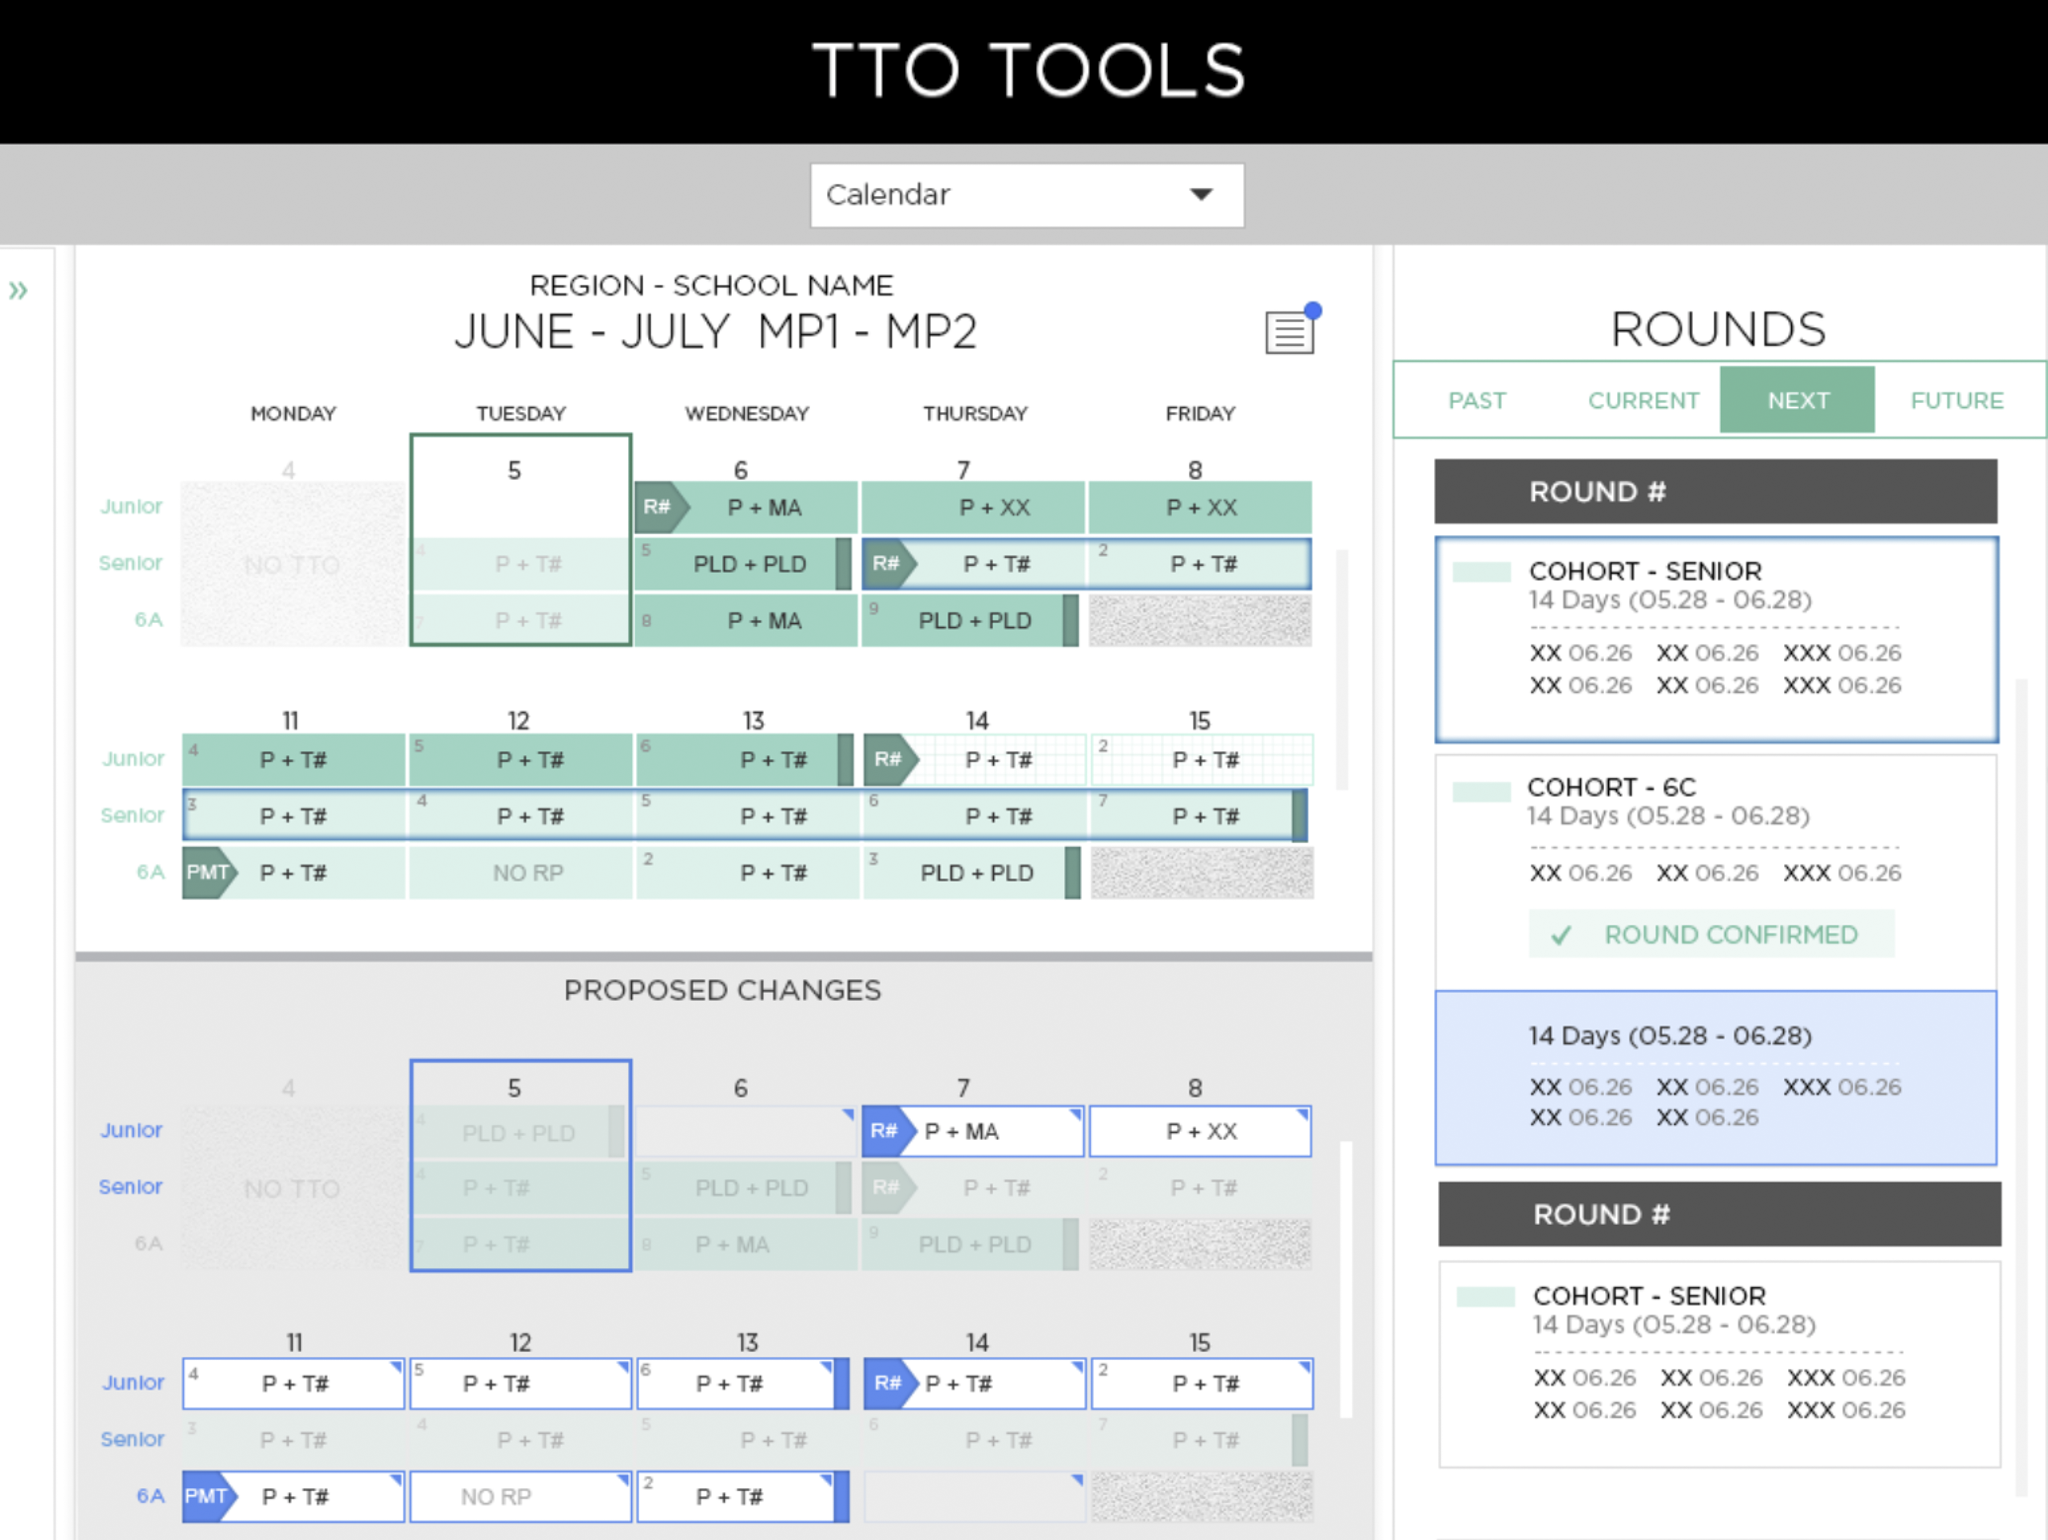
Teacher Portal
The primary instructional surface. Teachers arrive with 5 minutes before class, a list of students at different levels, and a need to know exactly what to do next. Every design decision had to serve that constraint.
- Scanability over density. Progress data displayed at a glance — no deep-diving required to get the signal a teacher needs.
- Consistent hierarchy across views. Same structure everywhere. A teacher who learns one view understands all of them.
- Predictable interaction patterns. Daily-use tools can't surprise users. Predictability is a feature.
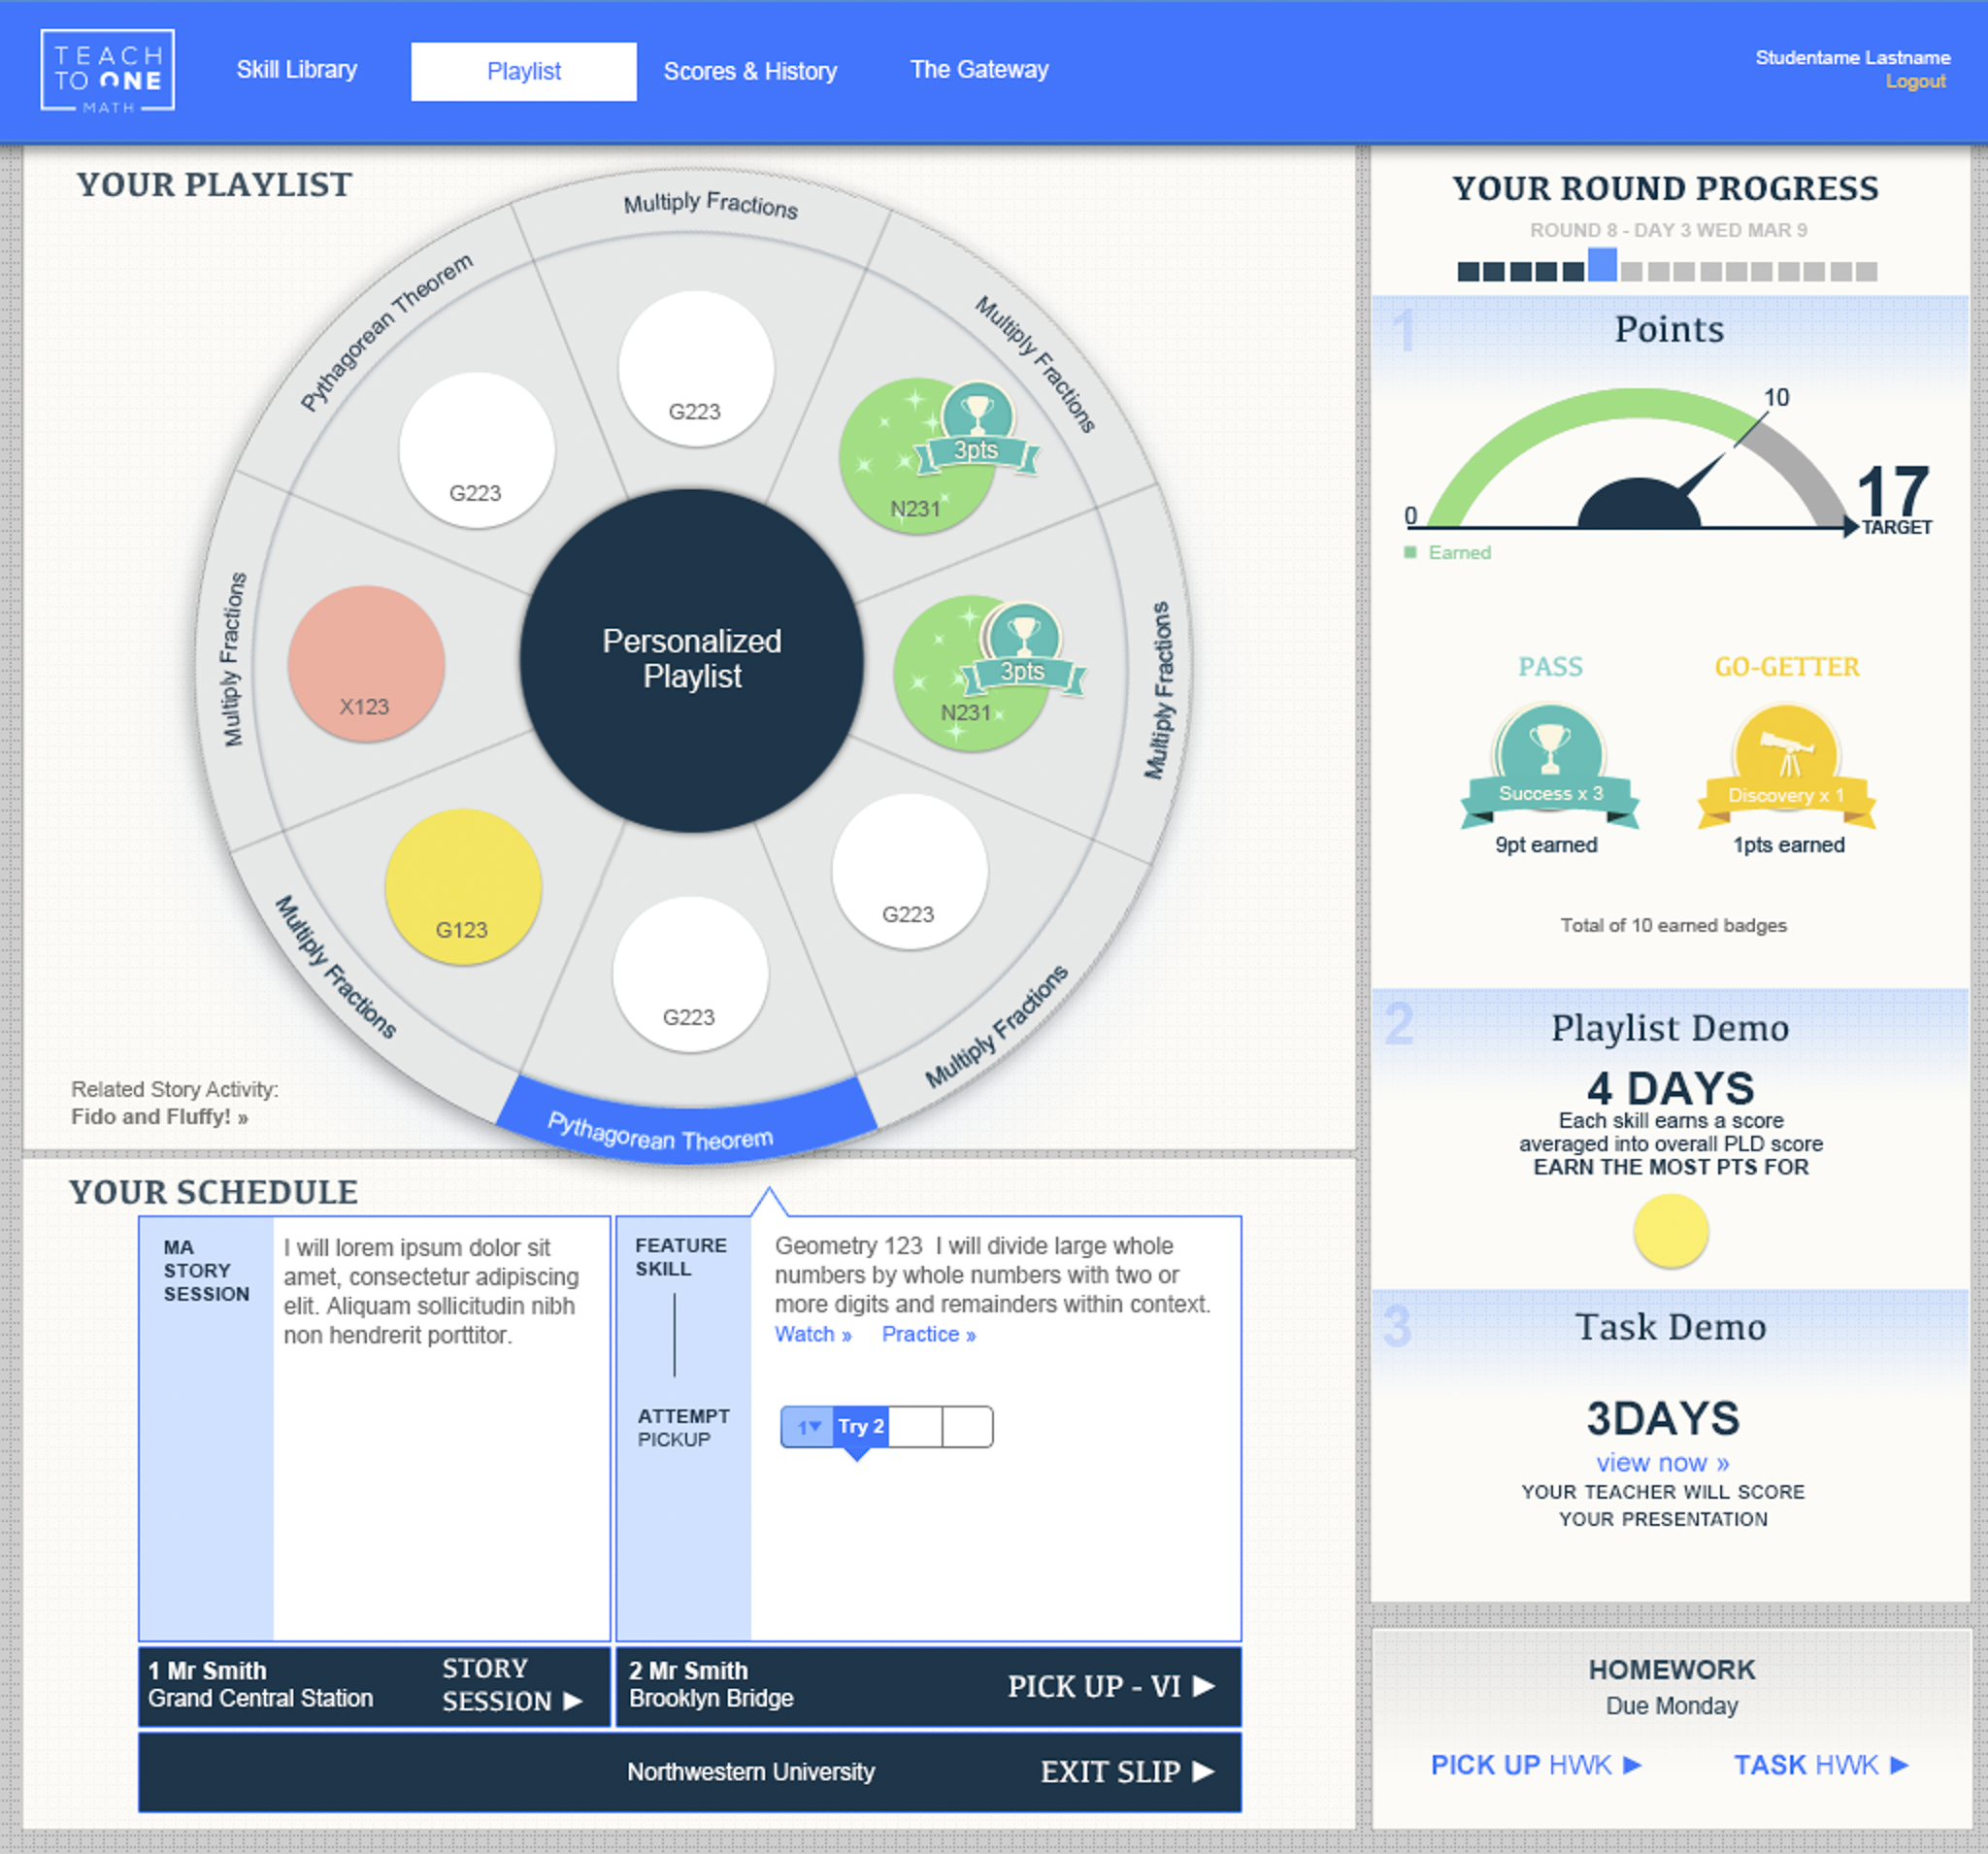
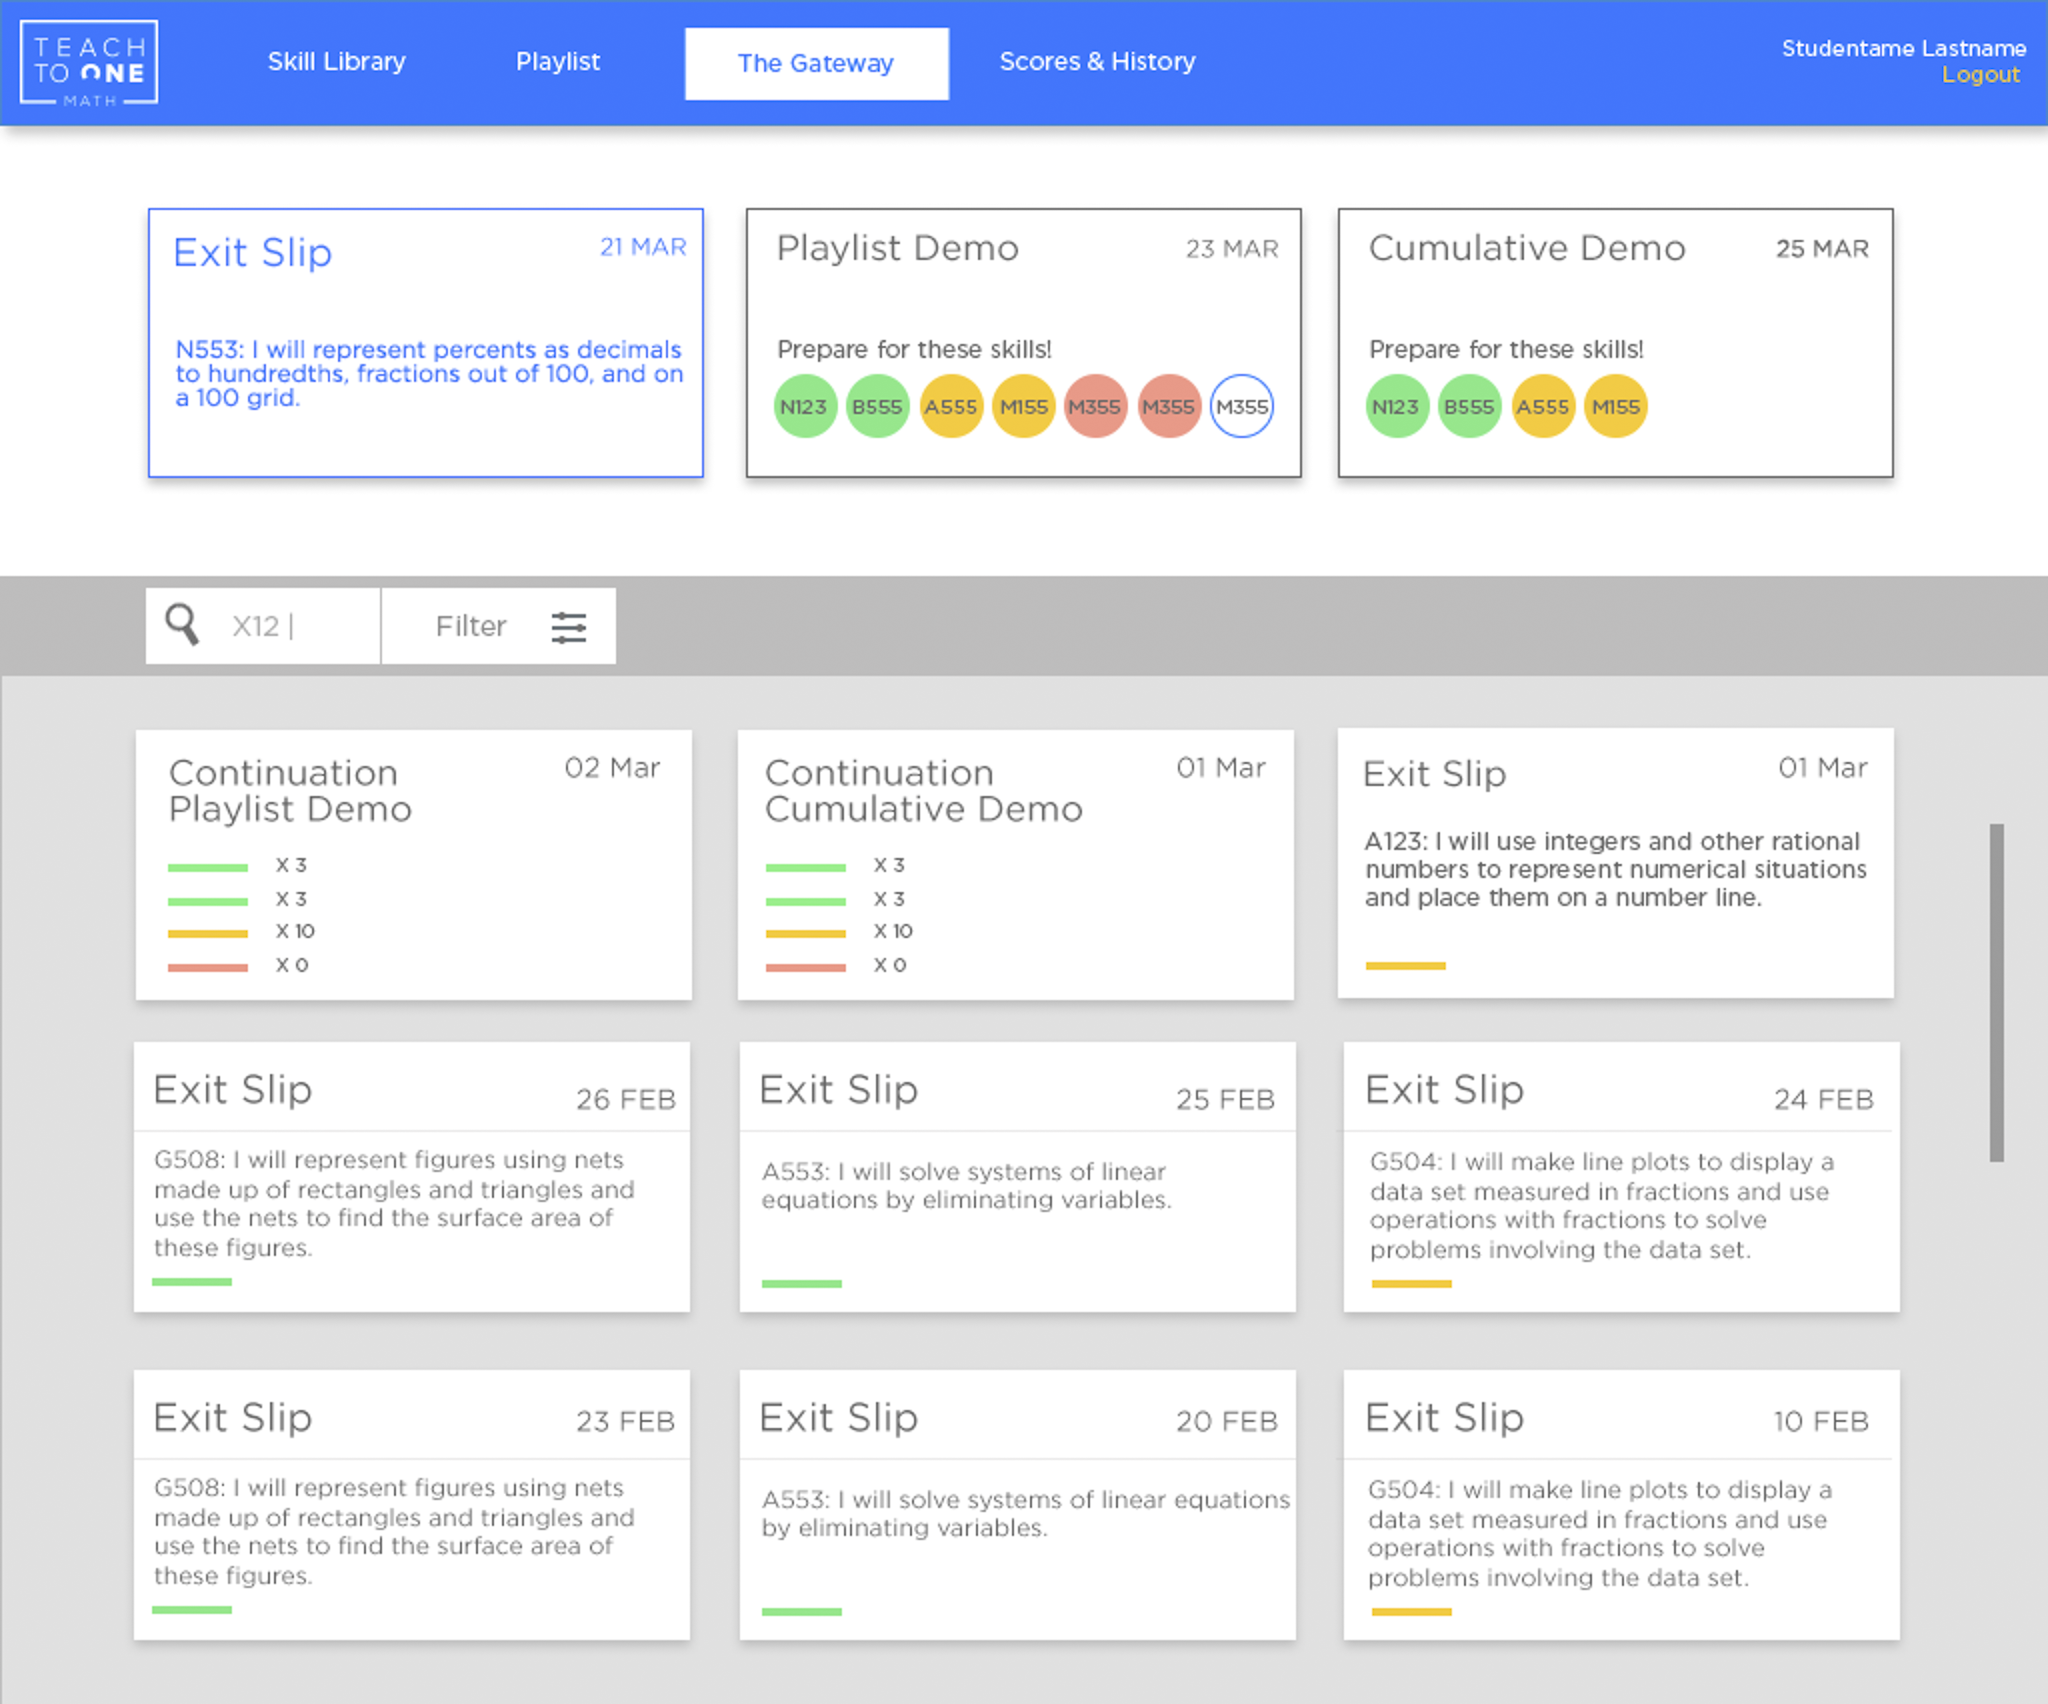
Student Portal
Students need to stay oriented, keep moving, and understand where they are without asking for help. The interface can't rely on novelty or motivation tricks — it has to be clear enough to work on its own, every day.
- Clarity over novelty. Engagement gimmicks fade. Clear, reliable feedback keeps students oriented session after session.
- Immediate feedback and momentum. Every action gets a response. Students shouldn't have to wonder if something worked.
- Consistent cues across sessions. What a student learns to read in week one should still work in week twelve.
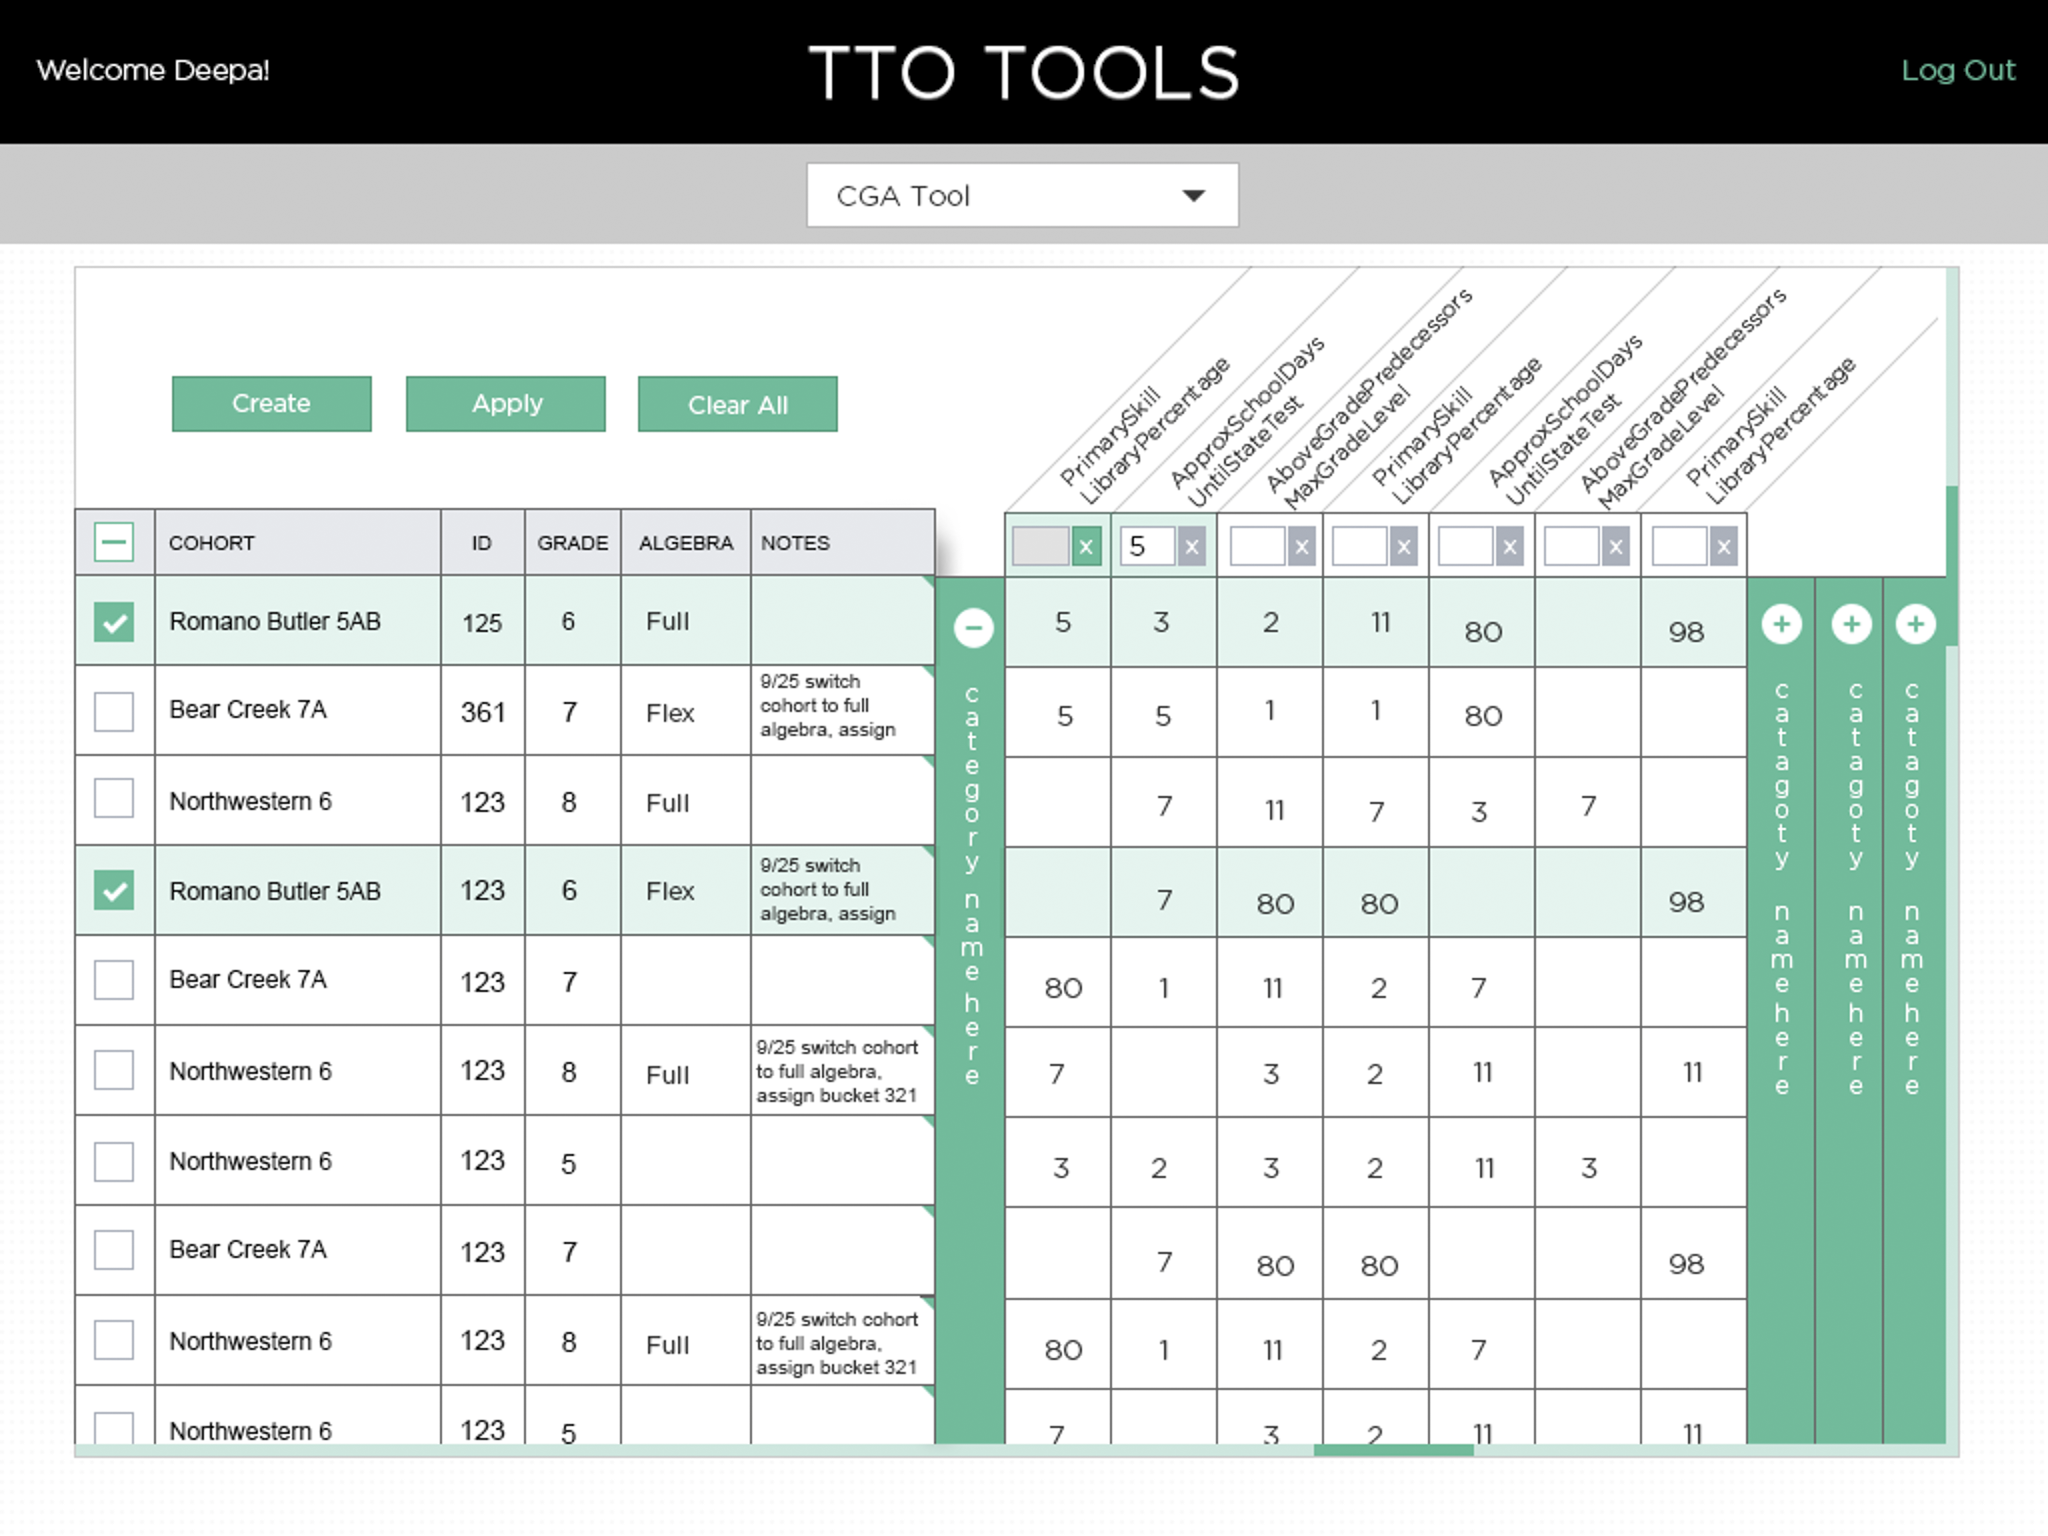
Internal Tools
Operations and analytics teams were spending enormous time on manual data work — spreadsheet-heavy processes that were slow, error-prone, and non-scalable. The internal tools replaced that overhead with designed workflows that made the data readable and the decisions faster.
- Accuracy and trustworthiness first. Internal teams make decisions from these views. Wrong data presentation is a product failure.
- Reusable structures across datasets. The same template logic works across different data sets — one pattern to learn, infinite applications.
- Replaced ~10 hours of manual work per analyst per week. That's not a UX win — it's an operational one. The design got out of the way.
What made it work across three surfaces for eight years
Longevity in design comes from decisions that scale — not from clever solutions to specific problems. The work at New Classrooms was about building reusable logic: component patterns, hierarchy rules, and interaction conventions that could be applied across new features without rethinking the fundamentals.
The CSS/HTML guidelines I established were adopted organization-wide — meaning non-designers could build within the system without breaking it. That's the real measure of a design system: does it hold up when the designer isn't in the room?
- Reusable CSS/HTML component guidelines adopted across the organization — design consistency maintained without requiring designer involvement in every build.
- Shared design logic across all three surfaces — a teacher who uses the portal recognizes patterns in internal tools. Onboarding time drops.
- Hierarchy and interaction patterns consistent enough to train on — new team members could be onboarded to the design system, not just individual features.
- Marketing assets aligned with the product design language — external communications and internal tools shared the same visual system.
Eight years of outcomes — the ones that held up
Not all outcomes from an 8-year engagement fit in a bullet list. These are the ones that were measurable, verifiable, and structurally meaningful.
Daily active usage increased 22% through UX and interaction redesign — teachers using the portal more often, which meant the product was doing its job.
~10 hours per week per analyst recovered — spreadsheet-based workflows replaced by tools that made the same work faster and more accurate.
Shared design logic across all three surfaces — a system coherent enough that one designer could own all of it, and hand it off without it collapsing.
CSS/HTML component guidelines adopted org-wide — non-designers building within the system without breaking it. That's the bar for a working design system.
National scale deployment — interfaces designed in New York used daily by students and teachers across the country, with no regional customization required.